How to Read a Nautical Chart
Learn how to interpret a nautical chart before planning a passage: scale, latitude and longitude, depth soundings, contours, chart datum, rocks, wrecks, buoys, lights, compass roses, magnetic variation and route hazards. Then practise on an interactive training chart.
What a nautical chart tells you
A nautical chart is a navigation tool showing the shoreline and seafloor together with water depths, hazards, aids to navigation, anchorages and other information important to safe passage. Unlike a road map, it is designed to help you decide where a vessel can safely go.
Water
Soundings, depth contours, drying areas, channels, shoals and seabed characteristics.
Hazards
Rocks, wrecks, obstructions, cables, restricted areas and dangers that may not be visible above water.
Navigation
Buoys, beacons, lights, leading lines, compass information, positions and distances.
Interactive training chart
Click features on this simplified training chart. It is intentionally schematic and does not represent a real navigation area.
Explore the chart
Click the coastline, depth contour, soundings, rock, wreck, buoy, light, anchorage, cable, compass rose or route.
Real charts use standardized symbols and abbreviations; always consult the chart's own legend and the relevant official symbol reference.
1. Start with the chart title, edition and scale
Read the marginal information first
- Chart title and geographic coverage
- Scale
- Depth and height units
- Horizontal datum / positioning reference
- Vertical datum for depths
- Edition and correction/update information
- Warnings, notes and source diagrams
Understand scale
A 1:25,000 chart shows more detail than a 1:250,000 chart. Use the largest-scale suitable chart available for close navigation, harbour approaches and confined waters.
At 1:50,000, 1 cm on the chart represents 500 m on the ground.
Interactive chart-scale calculator
2. Latitude, longitude and position
Latitude measures north/south position and longitude east/west position. On a traditional chart, latitude is read from the side borders and longitude from the top or bottom. One minute of latitude corresponds approximately to one nautical mile, which is why the latitude scale is commonly used for measuring distance on Mercator navigation charts.
Position trainer
This visual exercise uses an arbitrary centre position. It teaches axis direction, not real-world plotting accuracy.
Coordinate format converter
Boaters commonly encounter decimal degrees (DD) and degrees with decimal minutes (DMM). This converter helps you understand the format difference.
3. Depth soundings, contours and chart datum
Numbers printed in the water are soundings: measured depths reduced to the chart's stated vertical datum. The chart tells you whether depths are metres, feet or fathoms. Depth contours connect areas of similar depth and make shoals, channels and slopes easier to recognize.
Interactive under-keel clearance planner
Use this only as a planning exercise. Real navigation requires the charted datum, predicted/observed water level, squat, heel, wave response, uncertainty and a safety policy appropriate to the vessel and area.
4. Rocks, wrecks and obstructions
Rock
A rock symbol can indicate a feature that is always submerged, awash, covers and uncovers, or is visible above water. The exact symbol matters.
Wreck
Wreck symbols vary according to whether the wreck is visible, dangerous, non-dangerous, surveyed and whether a least depth is known.
Obstruction
Obstructions can include submerged objects, foul ground and other features that may make anchoring or navigation unsafe.
Never infer clearance from the word “wreck” or a generic symbol alone. Decode the exact chart symbol and associated sounding/least-depth information.
Interactive symbol decoder
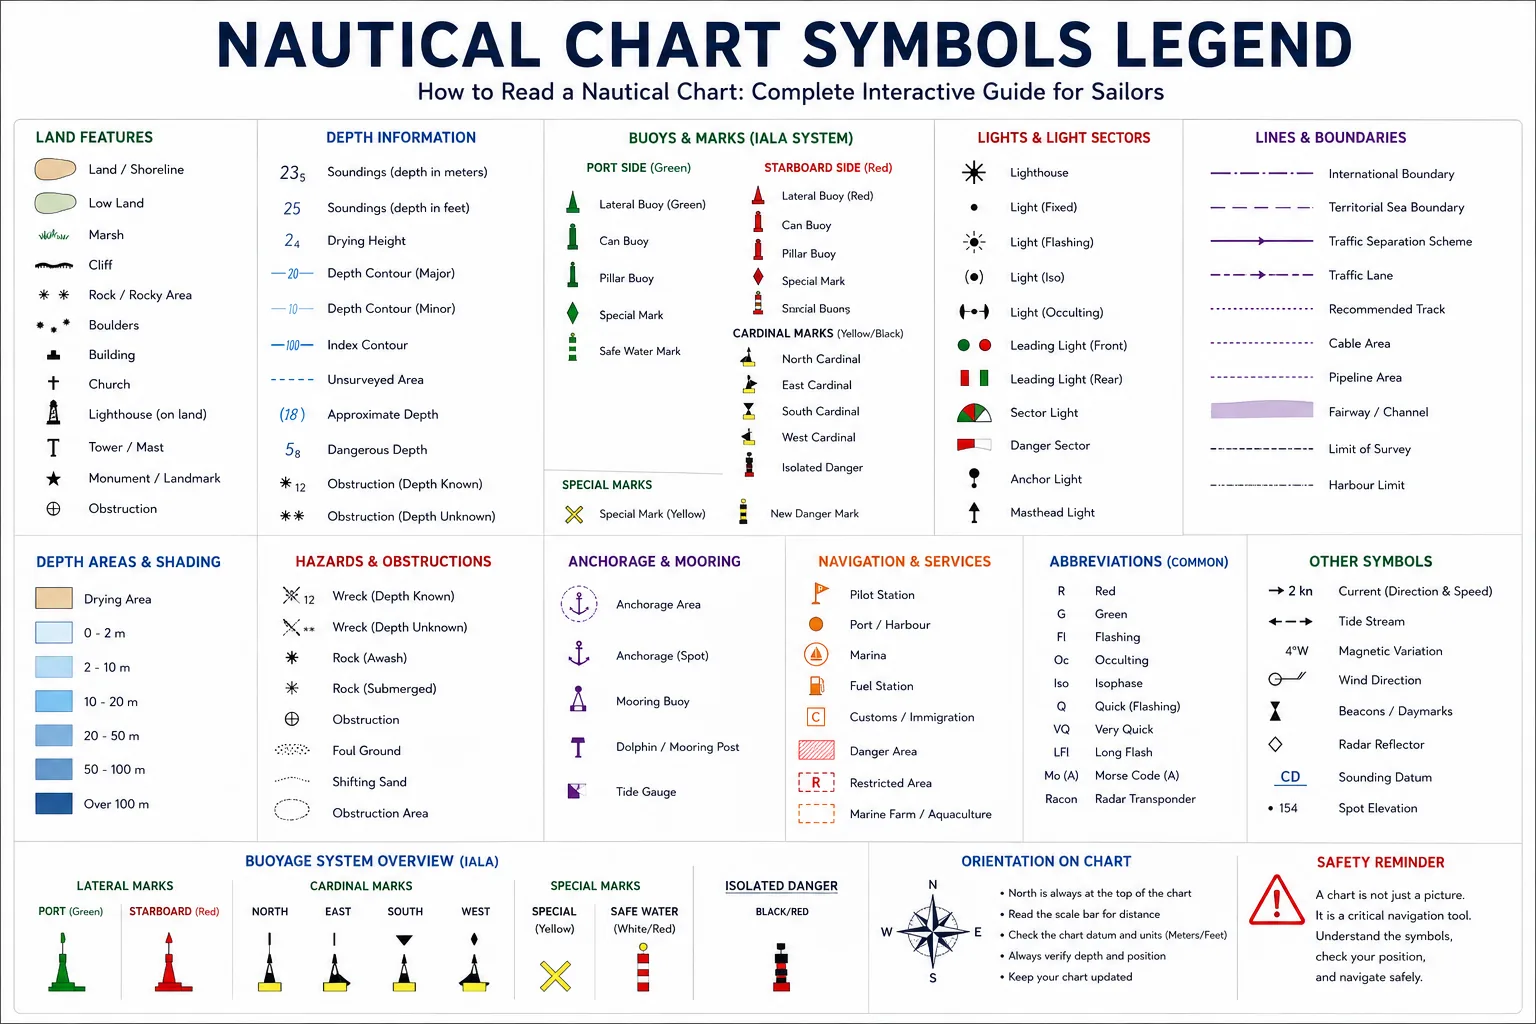
Click a training symbol to reveal what category of information you should look for. These icons are simplified teaching graphics, not replacements for official INT 1 symbols.
5. Buoys, beacons and lights
Aids to navigation help identify channels, dangers and positions. On charts you may see the aid's shape/colour information plus light characteristics such as colour, flashing rhythm and period. A notation such as Fl R 4s describes a flashing red light with a 4-second period.
| Chart clue | What it can describe | What to verify |
|---|---|---|
| Fl | Flashing characteristic | Colour, group, period and charted position |
| Oc | Occulting characteristic | Pattern and period |
| Iso | Isophase light | Equal light/dark timing and colour |
| Q / VQ | Quick / very quick flashing | Group, colour and navigational purpose |
| Sector | Different light sectors | Bearings and colours of sectors |
Interactive light-characteristic trainer
6. Compass rose, true direction and magnetic variation
The compass rose lets you plot or read directions. Charts may show true and magnetic information and a stated magnetic variation for a reference year with an annual rate of change. For current navigation, calculate or obtain the current variation rather than assuming an old printed value is still correct.
Training convention used here: magnetic = true − easterly variation, or true + westerly variation. Verify the convention and current variation used by your navigation system/training authority.
7. Measure distance correctly
On a Mercator paper chart, distance is measured against the latitude scale at approximately the same latitude as the route. One minute of latitude is approximately one nautical mile. Do not use the longitude scale for distance.
8. Seabed, anchorages and holding
Charts may use abbreviations to describe seabed materials such as sand, mud, rock or combinations. These clues can help with anchoring, but they do not replace current local knowledge, sonar, visual assessment or the vessel's anchoring procedure.
Sand
Often favourable for many common anchors when sufficiently deep and free of hazards.
Mud
Can provide strong holding, but soft layers, debris and local conditions matter.
Rock / foul ground
May provide poor or unpredictable holding and can foul an anchor or chain.
Continue with How to Anchor a Boat Safely for scope, setting and drag checks.
9. Route planning: never draw a line and stop thinking
A safe route is more than a line between A and B. Check the full corridor around the intended track for depth, hazards, traffic, restricted areas, visibility, wind, sea state, tide/current, escape options and position uncertainty.
Interactive passage-risk checker
10. Paper chart vs electronic chart
Paper / printed chart
- Excellent overview of an area
- Scale and source information remain visible
- Useful for learning traditional plotting
- Requires manual correction/update discipline
ENC / chartplotter
- Can integrate GNSS position, AIS and route monitoring
- Display can filter or emphasize objects by settings
- Zooming does not create survey detail that does not exist
- Requires current data and correct safety/display settings
Chart-reading decision tree
Skipper chart-reading checklist
Nautical chart quiz
Continue your navigation training
Review Marine VHF Radio Basics, Understanding the Beaufort Wind Scale, Boat Safety Checklist and Bareboat Skippering Guide.
For practical route planning, explore the TwoBoat sailing routes and use the route planner as an itinerary tool. Never treat a tourism route suggestion as a substitute for current navigational charts and professional passage planning.
Frequently asked questions
What do the numbers in the water mean on a nautical chart?
They are usually soundings: charted depths in the units stated by that chart and referenced to the chart's vertical datum. Always confirm units and datum before using them.
What does 1 minute of latitude equal?
For practical marine chart work, one minute of latitude corresponds approximately to one nautical mile.
What is chart datum?
Chart datum is the vertical reference surface to which charted depths are reduced. The actual water depth at a specific time depends on the water level relative to that datum plus local effects and uncertainty.
How do I know what a nautical-chart symbol means?
Use the chart legend and the official symbol publication used by the relevant hydrographic office. IHO INT 1 is the international reference for symbols and abbreviations on charts compiled to IHO specifications.
Can I navigate only with a phone chart app?
Do not assume a consumer app alone satisfies the navigation requirements or safety needs of your vessel and area. Verify the source and currency of chart data, offline availability, hardware redundancy, positioning reliability and applicable rules.
What is the difference between a nautical chart and a map?
A nautical chart is specifically designed for navigation and includes hydrographic information such as depths, hazards and aids to navigation that ordinary maps do not provide.
Authoritative chart references
Continue reading
Build your Croatia sailing knowledge with related TwoBoat guides, software, guides and planning tools.